
Projecting childcare enrollment means estimating how many children each classroom will serve in the weeks, months, and years ahead. An accurate projection helps childcare operators anticipate openings, plan classroom transitions, manage waitlists, schedule staffing, and protect future revenue.
The most reliable approach is to build a child-by-child enrollment plan—not rely only on historical averages. By mapping each child’s expected start date, schedule, classroom transitions, and departure date, you can see when capacity will become available and match the right families to those openings sooner.
This guide explains how to project childcare enrollment manually, where spreadsheets begin to break down, and how a living child schedule can turn enrollment forecasting into an actionable capacity plan.
How to Build a Child-by-Child Childcare Enrollment Projection
A useful enrollment projection should show more than an estimated total. It should reveal which classrooms will have openings, when those openings will occur, and which families may be able to fill them.
Record Each Child’s Current Schedule and Classroom
Begin with the children currently enrolled in each classroom. Record:
Current classroom
Days of the week each child attends
Start date
Expected weekly schedule
Age or program eligibility
Using each child’s actual schedule produces a more accurate picture than treating every enrollment as a full-time seat.
Map Expected Classroom Transitions and Departure Dates
Estimate when each child will move into the next classroom or leave the program. Consider:
Age-based classroom transitions
School-year and kindergarten departures
Planned schedule changes
Family-provided withdrawal dates
Program-specific eligibility requirements
When one child transitions, capacity may open in one classroom while being consumed in another. These connected movements should be included in the same projection.
Calculate Future Capacity by Classroom and Date
For each future week or month, compare the number of children scheduled with the usable capacity of that classroom.
This helps you identify:
Classrooms approaching capacity
Openings that will appear after a transition
Days with unused part-time capacity
Periods when staffing or room configurations may need to change
Review capacity by day whenever children attend part-time schedules. A classroom can be full on Monday and still have sellable openings later in the week.
Match Waitlisted Families to Known Openings
Organize waitlisted and prospective families by:
Child’s age
Requested start date
Required schedule
Preferred location
Classroom eligibility
Compare these needs with your projected openings. Contacting an appropriate family before the opening occurs can reduce the time that capacity remains unfilled.
Update the Projection Regularly
An enrollment projection is an operating plan, not a one-time report. Review it whenever a child enrolls, changes schedules, transitions classrooms, or provides notice.
A consistent weekly review helps directors and enrollment teams spot changes early and act before an opening becomes lost revenue.
The Limits of Manual Enrollment Forecasting
Spreadsheets can help a center begin projecting enrollment, but they become difficult to maintain as schedules, classrooms, and family plans change.
A manual projection can quickly become outdated when:
A child changes attendance days
A classroom transition moves earlier or later
A family postpones its requested start date
A child withdraws unexpectedly
Multiple directors maintain separate records
One change affects capacity in several future classrooms
The larger the organization becomes, the harder it is to keep enrollment, waitlists, classroom capacity, billing, and revenue projections synchronized.
Forecasting Predicts. A Living Schedule Makes Capacity Actionable.
Traditional enrollment forecasting estimates what may happen based on current totals, historical trends, or manually maintained assumptions.
A living child schedule goes further. It maps each child’s expected journey through future classrooms and programs. When a schedule changes, the organization can see how that change affects future openings, classroom capacity, billing, and projected revenue.
This turns enrollment forecasting from a periodic report into an operating plan your team can use every day.
A worked example: why weekly averages can hide a full day
Imagine a classroom with usable, staffed capacity for 12 children each day. The confirmed schedule for a future week is shown below. These numbers are illustrative, not a staffing or licensing recommendation.
| Day | Scheduled | Open places |
|---|---|---|
| Monday | 12 | 0 |
| Tuesday | 10 | 2 |
| Wednesday | 12 | 0 |
| Thursday | 9 | 3 |
| Friday | 11 | 1 |
The room has six open child-days across the week, or 1.2 five-day equivalents. It has no full-week opening, because Monday and Wednesday are already full.
A child needing Tuesday and Thursday could fit this week if eligible for the room and those places remain available through the proposed enrollment period. After enrolling that child, Tuesday has one open place and Thursday has two.
Next, check the child’s future room transition and any planned attendance changes. Availability for one week does not establish availability for the child’s full program journey. Keep tentative inquiries separate from confirmed enrollment when reviewing your plan.
Turn the opening into an action
Assign an owner to confirm the family’s requirements, validate the schedule across future periods, and record the agreed start and transition dates. Then check the charges and projected revenue for those periods.
Evaluating software for this process? Use our 13-feature evaluation checklist or software buyer guide.
Explore Your Enrollment WorkflowHow CareDay Turns Enrollment Projections Into Action
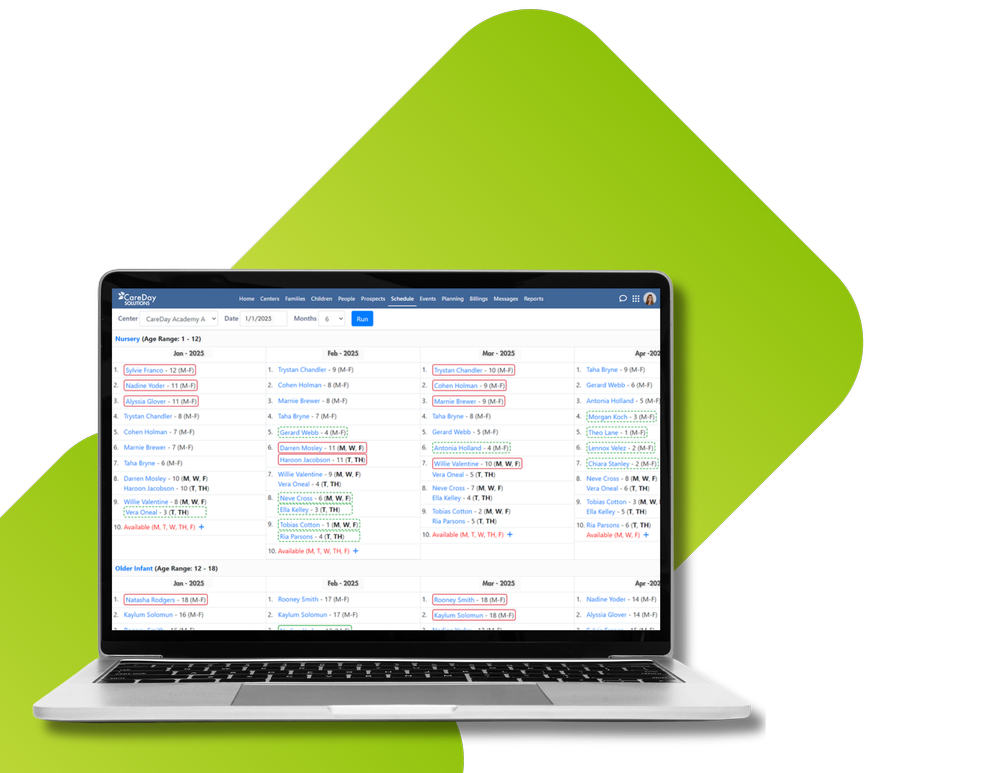
CareDay’s enrollment management software connects each child’s schedule with future classroom transitions, capacity, waitlists, billing, and revenue.
With CareDay, childcare operators can:
- ✓Schedule children through future classrooms and programs
- ✓See classroom openings months or years ahead
- ✓Match waitlisted families with appropriate capacity
- ✓Connect enrollment commitments with schedules and billing
- ✓Compare capacity and projected revenue across locations
Balanced Family Academy used CareDay to maintain 95–98% full-time enrollment, sell 3,982 additional childcare days, and collect $278,212 in additional revenue during 12 months.
Turn Future Openings Into Fuller Classrooms
See how CareDay can help your organization plan future capacity, match families with openings, and keep classrooms fuller.